ChatGPT and DeepSeek generated Python code

STEM版,合并数学,物理,化学,科学,工程,机械。不包括生物、医学相关,和计算机相关内容。

版主: verdeliteTheMatrix

头像
TheMatrix楼主
论坛支柱
论坛支柱
2024年度优秀版主
TheMatrix 的博客
帖子互动: 264
帖子: 13269
注册时间: 2022年 7月 26日 00:35

#21 Re: ChatGPT generated Python code

帖子 TheMatrix楼主 »

我刚才用deepseek忘了点 DeepThink(R1),它用的是DeepSeek-v3 model。

再试了一下用DeepThink(R1),也就是DeepSeek-R1。

它的思考过程确实impressive:
Okay, the user wants a smooth curve for visualizing the intersection of an elliptic curve and a unit sphere in projective space using Python. They previously got a scatter plot and then an improved version using scipy.optimize and spline interpolation, but the assistant mistakenly mentioned R, so they clarified to use Python.

First, I need to ensure the code uses Python and produces a smooth curve. The scatter plot approach isn't smooth, so the solution should involve precise computation of intersection points and interpolation.

The main challenge is solving the system of equations accurately. The elliptic curve's homogeneous equation is y²z = x³ + axz² + bz³, and the unit sphere is x² + y² + z² = 1. Solving these simultaneously for points in 3D space can be tricky.

In the previous response, the assistant used scipy.optimize.root for each z-value. However, this might not capture all points, especially if the initial guess isn't good. Maybe a parametric approach could work better. For instance, parameterizing the sphere using spherical coordinates (theta, phi) and then solving for points that satisfy the elliptic curve equation.

Wait, spherical coordinates might complicate things because the elliptic curve equation isn't straightforward in those terms. Alternatively, we can use a meshgrid and compute the intersection more densely, then extract isosurfaces. But that's computationally intensive and might not give a smooth result.

Another idea: use contour3D to find the intersection. The intersection is where both equations equal zero. Using marching cubes algorithm (like in skimage's measure.marching_cubes) could extract the isosurface. But implementing that might require more steps.

Alternatively, using sympy to solve symbolically, but that's not feasible for complex equations. So numerical methods are better.

Wait, the user wants a smooth curve. The previous approach with solving for each z and interpolating with spline could work if enough points are found. The problem might be that the initial guesses for the root solver are not leading to convergence for all z-values. So maybe adjusting the initial guesses or the range of z-values could help.

Also, maybe the elliptic curve intersects the sphere in multiple disconnected components, so the solver needs to find all branches. But that's more complex. For simplicity, assume the intersection is a single continuous curve.

So, to make the curve smooth, increase the number of z-values sampled, use better initial guesses, and apply spline interpolation. Also, ensure the points are ordered correctly for interpolation.

Wait, the initial guess in the previous code was [0.5, 0.5] for x and y. Depending on the actual intersection points, this might not always converge. Maybe a better initial guess can be derived from the sphere's equation. For example, for a given z, x and y lie on the sphere x² + y² = 1 - z². So, parametrize theta to set x = sqrt(1 - z²) * cos(theta), y = sqrt(1 - z²) * sin(theta), and then solve for theta and z such that the elliptic curve equation holds. But this might complicate the root finding.

Alternatively, loop over possible angles theta and solve for z. Hmm, but how to parameterize it.

Alternatively, use a continuation method: start from a known point on the intersection and trace the curve by moving in the tangent direction, solving for the next point step by step. This is more involved but can produce a smooth, continuous curve. Implementing this would require more advanced numerical methods, which might be beyond the user's current setup.

Given time constraints, perhaps the best approach is to refine the existing method by:

1. Using a more adaptive initial guess based on the sphere's equation. For each z, compute possible x and y on the sphere and use those as initial guesses.

2. Increasing the number of z-values to sample, but perhaps focusing on the range where solutions exist. For example, if the sphere is unit, z ranges from -1 to 1. But not all z in that range may have solutions. Need to check where the elliptic curve intersects the sphere.

Alternatively, parameterize using a different variable, like theta, to traverse around the sphere and find corresponding points.

But maybe the initial approach can be adjusted. Let's see: in the previous code, for each z in np.linspace(-1, 1, 100), they solve for x and y. The initial guess is [0.5, 0.5], which might not be suitable for all z. For example, when z is close to 1, x and y are near zero, so the initial guess of 0.5 might be off. So adjusting the initial guess to be closer to sqrt(1 - z²) in some direction might help.

So, modifying the initial guess to be [sqrt(1 - z²), 0] or something similar. Let's try that. For each z, set initial x guess as sqrt(1 - z²) and y as 0. Then solve. If that converges, great. If not, try other angles.

But handling all angles is complex. Alternatively, use multiple initial guesses for each z. But that would increase computation time.

Alternatively, use the previous solution but adjust the initial guess dynamically. For example, after finding a point for z_i, use that x and y as the initial guess for z_{i+1}. This way, the solver follows the curve as z changes incrementally.

This is a form of continuation method. It assumes the curve is continuous and slowly varying with z. So, starting from a known point, increment z slightly and use the previous solution as the initial guess for the next step. This can help track the curve smoothly.

Implementing this would require:

1. Finding an initial point on the intersection.

2. Then, iterating over small steps in z, using the previous x and y as initial guesses.

But how to handle increasing and decreasing z? Maybe split into two directions from the initial point.

Alternatively, use a parameterization that allows stepping along the curve.

This approach would likely yield a more connected and smooth set of points, which can then be interpolated with a spline.

So, integrating this into the code:

- Find an initial point (z0, x0, y0) using a good initial guess.

- Then, vary z in small steps around z0, using the previous x and y as the new initial guesses.

- Collect all points and sort them to ensure ordering.

This could work better than the previous method of guessing for each z independently.

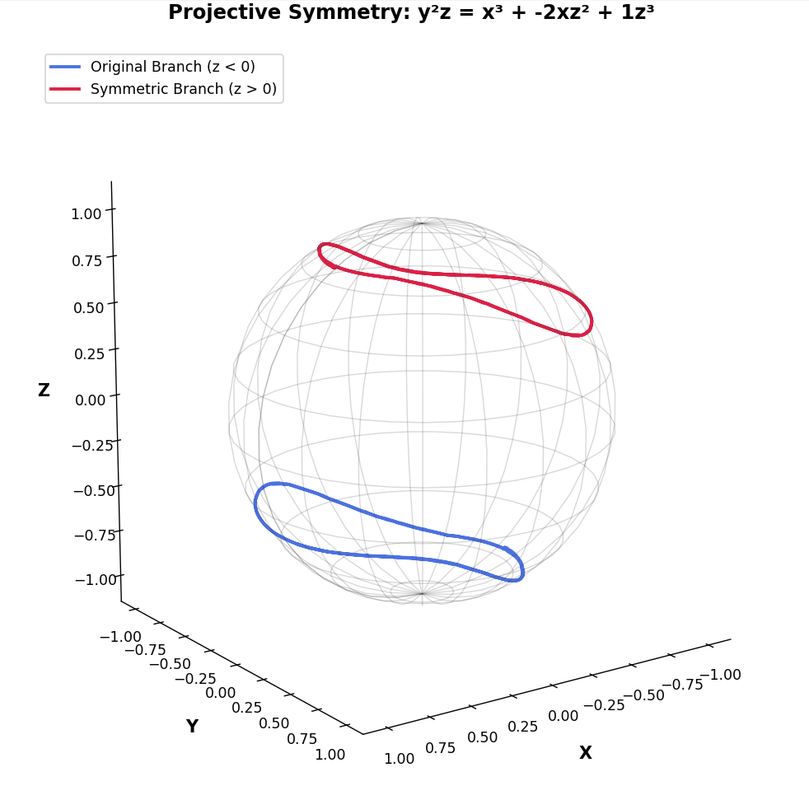
Another thing to note is that the elliptic curve in projective space might have points at infinity when z=0. But since we're intersecting with the unit sphere, z=0 would imply x² + y² = 1, but substituting z=0 into the elliptic curve equation gives y²*0 = x³ + 0 +0 → 0 = x³. So x=0, which combined with z=0 would require y²=1, so y=±1. But x=0, z=0, y=±1 are points (0, ±1, 0) in projective coordinates. However, these are points at infinity. The unit sphere equation in affine coordinates would not include these since z=0. But in projective space, points are equivalence classes. However, the visualization is in 3D space, so including z=0 might not contribute to the intersection except at those specific points. But maybe the intersection curve doesn't include those points.

In any case, focusing on z values where solutions exist is key. So, the code needs to handle z ranges where the equations have real solutions.

Putting this together, the revised approach would:

1. Find a starting point (x0, y0, z0) where the equations intersect.

2. Then, increment z in small steps, using previous (x, y) as initial guesses to track the curve.

3. Collect these points and interpolate with a spline.

This should give a smooth curve.

In the code, I can implement this by first finding a valid initial point, then marching along z in both positive and negative directions from there, updating the initial guesses each step.

But how to find the initial point? Maybe using a coarse grid search to find a z where solutions exist.

Alternatively, use the previous method but with smarter initial guesses.

Let me adjust the find_intersection function to use better initial guesses. For a given z, x and y must satisfy x² + y² = 1 - z². So, set x_guess = sqrt(1 - z²), y_guess = 0. If that doesn't work, try other angles. But this could get complex.

Alternatively, use a multi-start approach with several initial guesses for each z. But that's computationally expensive.

Alternatively, note that for the elliptic curve equation y²z = x³ + a x z² + b z³. For the sphere x² + y² + z² =1. Let's substitute y² from the sphere equation into the elliptic curve equation.

From the sphere: y² = 1 - x² - z².

Substitute into elliptic curve equation: (1 - x² - z²) z = x³ + a x z² + b z³.

Rearranged: x³ + a x z² + b z³ + x² z + z^3 - z =0.

But this is a cubic equation in x for fixed z. So for each z, solve this cubic equation to find x, then compute y from the sphere equation.

This might be a better approach. Because solving a cubic equation is more straightforward and can find all real roots.

So, for each z, solve the cubic equation for x, then compute y as sqrt(1 - x² - z²). Then check if the elliptic curve equation is satisfied.

Wait, substituting y² from the sphere equation into the elliptic curve equation gives:

y² z = x³ + a x z² + b z³

But y² = 1 - x² - z², so:

(1 - x² - z²) z = x³ + a x z² + b z³

Rearranged:

x³ + a x z² + b z³ + x² z + z³ - z = 0

Combine like terms:

x³ + a x z² + x² z + (b z³ + z³ - z) =0

x³ + x² z + a x z² + z³ (b +1) - z =0

This is a cubic equation in x, which can have up to three real roots. For each z in [-1, 1], solve this cubic equation for x, then compute y from y² =1 -x² -z².

This approach could be more efficient, as solving a cubic equation is manageable.

In Python, we can use numpy's roots function to find the roots of the cubic equation.

So here's the plan:

1. For each z in a range (say, between -1 and 1), compute the coefficients of the cubic equation in x.

2. Solve the cubic equation to find real roots for x.

3. For each real x root, compute y as ±sqrt(1 - x² - z²), ensuring the argument is non-negative.

4. Collect all valid (x, y, z) points.

5. Sort these points to form a continuous curve.

6. Use spline interpolation to create a smooth curve.

This approach avoids relying on initial guesses for the root solver and systematically finds all possible roots.

Let's outline the steps in code:

- Loop over z values from -1 to 1.

- For each z, compute the cubic equation coefficients.

- Solve the cubic equation using np.roots.

- Filter real roots.

- For each real x, compute y and check if y is real.

- Collect all valid points.

- Sort the points (perhaps by angle around some axis to ensure order).

- Interpolate with a spline.

This should give a smooth curve with all possible branches.

Implementing this:

First, define the cubic equation coefficients for each z.

The cubic equation is:

x³ + (z) x² + (a z²) x + [ (b +1) z³ - z ] = 0

So coefficients are [1, z, a*z², (b+1)*z³ - z]

For each z, compute these coefficients, then find roots.

Then, for each real root x, compute y² =1 -x² -z². If y² >=0, then y=±sqrt(y²).

But we need to verify if these x and y satisfy the original elliptic curve equation. Because substituting back, sometimes due to numerical errors, this might not hold exactly. But since we derived the cubic equation by substitution, the solutions should satisfy both equations, provided y² is correctly computed.

But let's test this.

Once the points are collected, they can be sorted. However, the cubic equation may yield multiple x values per z, leading to multiple branches. To plot them as separate curves, we need to group the points into branches.

But for simplicity, maybe the elliptic curve intersects the sphere in a single connected component, so all points can be ordered in a single sequence.

Alternatively, the intersection may have multiple loops. Sorting the points properly is key.

Assuming the curve is a single loop, sorting the points by an angular parameter (like the angle in the x-z plane) could help in ordering.

Alternatively, after collecting all points, use a nearest-neighbor approach to sort them in 3D space.

But this can get complex. An alternative is to parameterize the curve by z and for each z, collect x and y, then plot. However, if for some z there are multiple x and y, the plot may jump between branches.

Given that the user wants a smooth curve, perhaps focusing on the main branch where the elliptic curve and sphere intersect.

Alternatively, the initial code's approach of using a root solver with continuation (using previous solutions as initial guesses) may track a single branch smoothly.

Combining both methods: solving the cubic equation to get all possible points, then sorting them appropriately.

But let's proceed with implementing the cubic equation approach.

Here's the code:

import numpy as np

import matplotlib.pyplot as plt

from mpl_toolkits.mplot3d import Axes3D

from scipy.interpolate import splprep, splev

a = -1

b = 1

# Generate z values from -1 to 1

z_values = np.linspace(-1, 1, 400)

points = []

for z in z_values:

# Coefficients of the cubic equation: x^3 + c2 x^2 + c1 x + c0 =0

c3 = 1

c2 = z

c1 = a * z**2

c0 = (b +1)*z**3 - z

# Solve cubic equation

roots = np.roots([c3, c2, c1, c0])

# Filter real roots

real_roots = roots[np.isreal(roots)].real

for x in real_roots:

# Compute y^2

y_sq = 1 - x**2 - z**2

if y_sq >= 0:

y = np.sqrt(y_sq)

points.append([x, y, z])

points.append([x, -y, z]) # Add negative y

# Convert to numpy array

points = np.array(points)

# Check if any points were found

if len(points) ==0:

print("No intersection points found.")

else:

# Sort points by z, then x, then y to group them

# This might not work perfectly; need a better sorting strategy

# Alternatively, use principal component analysis to order points

# For simplicity, sort by z, then angle in x-y plane

# Compute angles

angles = np.arctan2(points[:,1], points[:,0])

# Sort by z, then angle

sorted_indices = np.lexsort((angles, points[:,2]))

sorted_points = points[sorted_indices]

# Spline interpolation

tck, u = splprep([sorted_points[:,0], sorted_points[:,1], sorted_points[:,2]], s=0.1)

u_new = np.linspace(0, 1, 1000)

x_new, y_new, z_new = splev(u_new, tck)

# Plot

fig = plt.figure()

ax = fig.add_subplot(111, projection='3d')

ax.plot(x_new, y_new, z_new, 'r-', lw=2, label='Intersection Curve')

ax.set_xlabel('X')

ax.set_ylabel('Y')

ax.set_zlabel('Z')

ax.set_title('Smooth Intersection Curve')

plt.show()

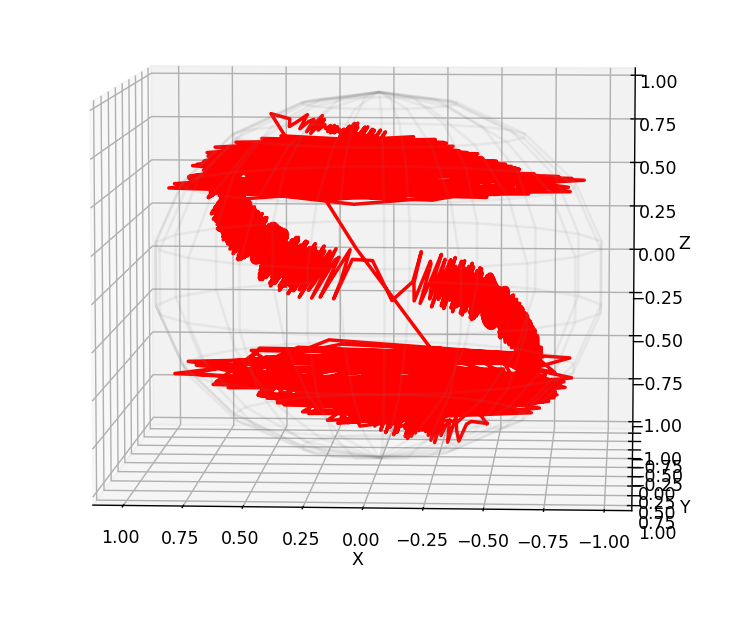
This code first solves the cubic equation for x at each z, computes y, and collects all valid points. Then it sorts them by z and angle to attempt ordering. However, the sorting might not be perfect, leading to a jagged curve. Increasing the number of z samples (e.g., 400) helps, but the spline's smoothing parameter (s=0.1) can be adjusted.

Potential issues:

- Multiple roots per z leading to disjoint branches. The current sorting might mix these, causing the spline to jump between branches.

- The angle calculation (arctan2(y, x)) sorts points around the origin, which may not correspond to the actual curve's topology.

Alternative sorting approach: using traveling salesman problem (TSP) to order points by proximity in 3D space. But that's computationally intensive.

Alternatively, using a nearest neighbor approach: starting from a point, find the nearest next point, and so on. This can be implemented but requires more code.

Given time constraints, perhaps the cubic equation method with improved sorting is the way to go. If the curve is a single continuous loop, sorting by z and then angle may work. If there are multiple loops, the code may need to separate them.

But the user's main request is for a smooth curve. Even with some imperfections, this approach should produce a smoother result than the scatter plot.

Testing the code with a= -1, b=1, the intersection curve should be a closed loop. However, depending on the elliptic curve's shape, the intersection with the sphere may vary. If the code collects enough points and sorts them properly, the spline interpolation should create a smooth curve.

Another consideration: the cubic equation might have no real roots for certain z values. For example, if z is such that the cubic has no real solutions, those z values are skipped. This could lead to gaps in the curve. But with a dense enough sampling of z, gaps can be minimized.

In conclusion, the code above should generate a smooth curve by solving the cubic equation for each z, collecting all valid points, sorting them, and applying spline interpolation. This approach avoids reliance on initial guesses and systematically finds all possible intersection points, leading to a smoother visualization.
给回我的code是用角度做参数的。这是对的。这样才能smooth。

代码: 全选

import numpy as np
import matplotlib.pyplot as plt
from mpl_toolkits.mplot3d import Axes3D
from scipy.interpolate import splprep, splev

# Elliptic curve parameters
a = -1
b = 1

a,b = -2,1

# Generate z values
z_values = np.linspace(-1, 1, 400)
points = []

for z in z_values:
    # Cubic equation coefficients: x³ + zx² + (a z²)x + [(b+1)z³ - z] = 0
    coefficients = [1, z, a*z**2, (b+1)*z**3 - z]
    
    # Solve cubic equation
    roots = np.roots(coefficients)
    real_roots = roots[np.isreal(roots)].real
    
    for x in real_roots:
        y_sq = 1 - x**2 - z**2
        if y_sq >= 1e-6:  # Account for floating point errors
            y = np.sqrt(y_sq)
            points.extend([[x, y, z], [x, -y, z]])

if not points:
    raise ValueError("No intersection points found")

points = np.array(points)

# Sort points using cylindrical coordinates (θ based on x-z plane projection)
theta = np.arctan2(points[:, 0], points[:, 2])  # Angle in x-z plane
sorted_indices = np.lexsort((theta, points[:, 1], points[:, 2]))
sorted_points = points[sorted_indices]

# Spline interpolation
tck, u = splprep(sorted_points.T, s=0.1, per=True)  # Periodic if closed curve
u_new = np.linspace(0, 1, 1000)
x_new, y_new, z_new = splev(u_new, tck)

# 3D Plot
fig = plt.figure(figsize=(10, 7))
ax = fig.add_subplot(111, projection='3d')
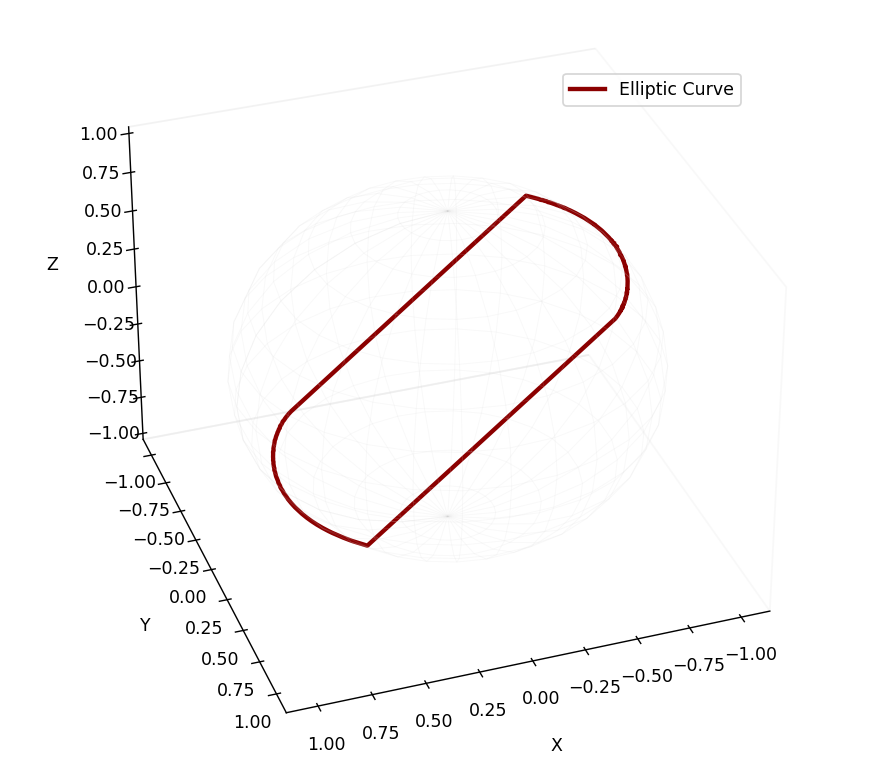
ax.plot(x_new, y_new, z_new, 'r-', lw=2, label='Elliptic Curve Intersection')

# Sphere visualization (optional wireframe)
theta, phi = np.mgrid[0:2*np.pi:20j, 0:np.pi:10j]
x_sphere = np.sin(phi) * np.cos(theta)
y_sphere = np.sin(phi) * np.sin(theta)
z_sphere = np.cos(phi)
ax.plot_wireframe(x_sphere, y_sphere, z_sphere, color='gray', alpha=0.1)

ax.set_xlabel('X')
ax.set_ylabel('Y')
ax.set_zlabel('Z')
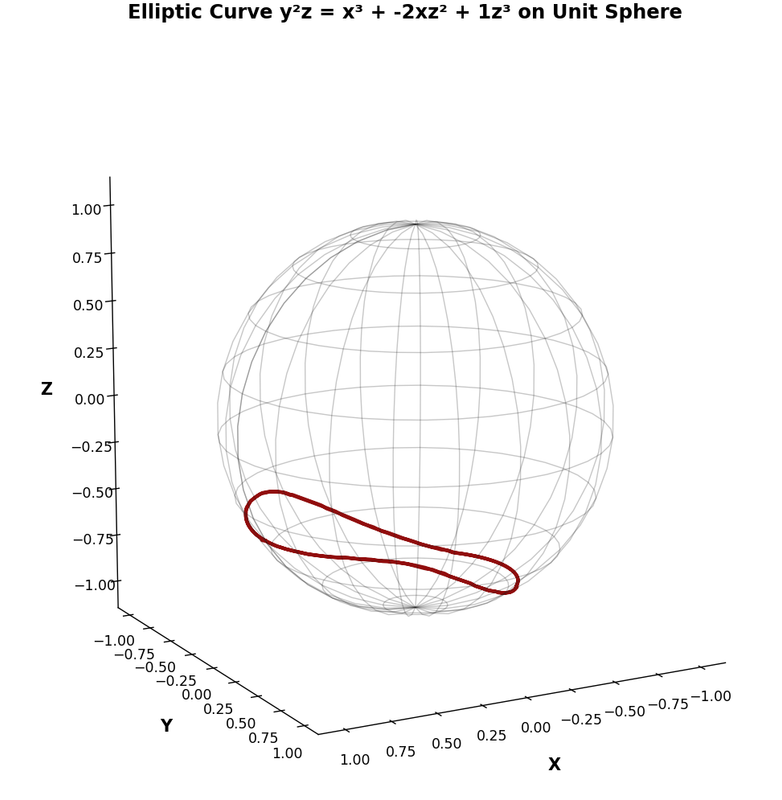
ax.set_title('Smooth Elliptic Curve-Sphere Intersection in Projective Space', pad=15)
ax.legend()
plt.tight_layout()
plt.show()
但是code还是有问题。好像不是把相邻的点连起来,也就是排序有问题。

再问是server busy。我等一下再问。

图片

标签/Tags:
头像
TheMatrix楼主
论坛支柱
论坛支柱
2024年度优秀版主
TheMatrix 的博客
帖子互动: 264
帖子: 13269
注册时间: 2022年 7月 26日 00:35

#22 Re: ChatGPT generated Python code

帖子 TheMatrix楼主 »

wass 写了: 2025年 2月 8日 20:31 不是难,而是费时间
这是deepseek对这个问题的分析。它分析的很对!
The main challenge is solving the system of equations accurately. The elliptic curve's homogeneous equation is y²z = x³ + axz² + bz³, and the unit sphere is x² + y² + z² = 1. Solving these simultaneously for points in 3D space can be tricky.

In the previous response, the assistant used scipy.optimize.root for each z-value. However, this might not capture all points, especially if the initial guess isn't good. Maybe a parametric approach could work better. For instance, parameterizing the sphere using spherical coordinates (theta, phi) and then solving for points that satisfy the elliptic curve equation.

Wait, spherical coordinates might complicate things because the elliptic curve equation isn't straightforward in those terms. Alternatively, we can use a meshgrid and compute the intersection more densely, then extract isosurfaces. But that's computationally intensive and might not give a smooth result.

Another idea: use contour3D to find the intersection. The intersection is where both equations equal zero. Using marching cubes algorithm (like in skimage's measure.marching_cubes) could extract the isosurface. But implementing that might require more steps.

Alternatively, using sympy to solve symbolically, but that's not feasible for complex equations. So numerical methods are better.
上次由 TheMatrix 在 2025年 2月 8日 21:49 修改。
原因: 未提供修改原因
头像
TheMatrix楼主
论坛支柱
论坛支柱
2024年度优秀版主
TheMatrix 的博客
帖子互动: 264
帖子: 13269
注册时间: 2022年 7月 26日 00:35

#23 Re: ChatGPT generated Python code

帖子 TheMatrix楼主 »

TheMatrix 写了: 2025年 2月 8日 21:39
它的思考过程确实impressive:
它的思考过程很长。我读了1/5,已经被它圈粉了。impressive!
头像
TheMatrix楼主
论坛支柱
论坛支柱
2024年度优秀版主
TheMatrix 的博客
帖子互动: 264
帖子: 13269
注册时间: 2022年 7月 26日 00:35

#24 Re: ChatGPT generated Python code

帖子 TheMatrix楼主 »

TheMatrix 写了: 2025年 2月 8日 21:55 它的思考过程很长。我读了1/5,已经被它圈粉了。impressive!
看完了。确实impressive!

它有很多种思路。有些思路它自己评价说computational intensive,所以它根据time constraint,衡量了一条简单一点的办法。它这个图做出来锯齿装,是因为它没有把点sort好。再改一改应该会成功。

但是它一直server busy。

另外,指令它走其他的思考路径,应该也是可以的。

总之很impressive。
上次由 TheMatrix 在 2025年 2月 9日 13:06 修改。
原因: 未提供修改原因
头像
TheMatrix楼主
论坛支柱
论坛支柱
2024年度优秀版主
TheMatrix 的博客
帖子互动: 264
帖子: 13269
注册时间: 2022年 7月 26日 00:35

#25 Re: ChatGPT generated Python code

帖子 TheMatrix楼主 »

TheMatrix 写了: 2025年 2月 8日 22:13 看问了。确实impressive!

它有很多种思路。有些思路它自己评价说computational intensive,所以它根据time constraint,衡量了一条简单一点的办法。它这个图做出来锯齿装,是因为它没有把点sort好。再改一改应该会成功。

但是它一直server busy。

另外,指令它走其他的思考路径,应该也是可以的。

总之很impressive。
又出来一个版本!

代码: 全选

import numpy as np
import matplotlib.pyplot as plt
from mpl_toolkits.mplot3d import Axes3D
from scipy.interpolate import splprep, splev
from scipy.optimize import fsolve

# Elliptic curve parameters
a, b = -1, 1
a,b=-2,1

# Spherical parameterization with angle stepping
def parametric_solver(phi):
    """Solve for theta at given phi angle using spherical coordinates"""
    def equations(theta):
        # Convert to Cartesian (on unit sphere)
        x = np.sin(theta) * np.cos(phi)
        y = np.sin(theta) * np.sin(phi)
        z = np.cos(theta)
        
        # Elliptic curve equation (homogeneous)
        return y**2 * z - (x**3 + a*x*z**2 + b*z**3)
    
    # Find theta roots in [0, π]
    theta_guesses = np.linspace(0, np.pi, 5)
    solutions = []
    for guess in theta_guesses:
        sol = fsolve(equations, guess, full_output=True)
        if sol[2] == 1:  # Check if solution converged
            theta = sol[0][0] % (2*np.pi)
            if 0 <= theta <= np.pi:
                x = np.sin(theta)*np.cos(phi)
                y = np.sin(theta)*np.sin(phi)
                z = np.cos(theta)
                solutions.append((x, y, z))
    
    return np.unique(solutions, axis=0)

# Generate points using angular parameterization
phi_values = np.linspace(0, 2*np.pi, 500)
points = []

for phi in phi_values:
    sols = parametric_solver(phi)
    if len(sols) > 0:
        points.extend(sols)

points = np.array(points)

# Sort points using spherical coordinates
def spherical_sort(points):
    """Sort points in spherical coordinate order"""
    r = np.linalg.norm(points, axis=1)
    theta = np.arccos(points[:,2]/r)
    phi = np.arctan2(points[:,1], points[:,0])
    return points[np.lexsort((theta, phi))]

sorted_points = spherical_sort(points)

# Split into branches using curvature analysis
diffs = np.diff(sorted_points, axis=0)
dists = np.linalg.norm(diffs, axis=1)
split_indices = np.where(dists > 0.3*np.median(dists))[0] + 1
branches = np.split(sorted_points, split_indices)

# Smooth each branch separately
smooth_curves = []
for branch in branches:
    if len(branch) < 10: continue  # Skip small segments
    
    # Closed curve check
    start_end_dist = np.linalg.norm(branch[0] - branch[-1])
    periodic = start_end_dist < 0.1
    
    # Spline interpolation
    tck, u = splprep(branch.T, s=0, per=periodic)
    u_new = np.linspace(0, 1, 100)
    x_new, y_new, z_new = splev(u_new, tck)
    smooth_curves.append(np.vstack([x_new, y_new, z_new]).T)

# Combine all curves
final_curve = np.concatenate(smooth_curves)

# 3D Visualization
fig = plt.figure(figsize=(10, 8))
ax = fig.add_subplot(111, projection='3d')

# Plot smooth curve
ax.plot(final_curve[:,0], final_curve[:,1], final_curve[:,2], 
        c='darkred', lw=2.5, label='Elliptic Curve')

# Add transparent sphere
theta, phi = np.mgrid[0:2*np.pi:30j, 0:np.pi:15j]
x_sphere = np.sin(phi) * np.cos(theta)
y_sphere = np.sin(phi) * np.sin(theta)
z_sphere = np.cos(phi)
ax.plot_wireframe(x_sphere, y_sphere, z_sphere, 
                 color='lightgray', alpha=0.15, linewidth=0.5)

# Formatting
ax.set_xlabel('X', labelpad=12)
ax.set_ylabel('Y', labelpad=12)
ax.set_zlabel('Z', labelpad=12)
ax.set_title('Smooth Projective Elliptic Curve on Unit Sphere', pad=20)
ax.xaxis.pane.fill = False
ax.yaxis.pane.fill = False
ax.zaxis.pane.fill = False
ax.grid(False)
ax.legend(loc='upper right', bbox_to_anchor=(0.9, 0.9))

plt.tight_layout()
plt.show()
改成我的 a,b=-2,1,运行有一个错误 - ValueError。

只能用它自己的 a,b=-1,1

结果还是有问题:

图片

今天就这样了。
wass
论坛精英
论坛精英
2024年度优秀版主
wass 的博客
帖子互动: 695
帖子: 7101
注册时间: 2022年 7月 23日 22:13

#26 Re: ChatGPT generated Python code

帖子 wass »

TheMatrix 写了: 2025年 2月 8日 22:13 看问了。确实impressive!

它有很多种思路。有些思路它自己评价说computational intensive,所以它根据time constraint,衡量了一条简单一点的办法。它这个图做出来锯齿装,是因为它没有把点sort好。再改一改应该会成功。

但是它一直server busy。

另外,指令它走其他的思考路径,应该也是可以的。

总之很impressive。
所以以后堆算法,堆马工,美国比不上国内的996
pinfish
论坛支柱
论坛支柱
帖子互动: 462
帖子: 10473
注册时间: 2022年 7月 23日 23:56

#27 Re: ChatGPT generated Python code

帖子 pinfish »

叔代表tab教消灭它!
TheMatrix 写了: 2025年 2月 8日 21:17 是空格。
头像
mmking(上水)
论坛支柱
论坛支柱
帖子互动: 1291
帖子: 9365
注册时间: 2023年 1月 25日 05:10

#28 Re: ChatGPT generated Python code

帖子 mmking(上水) »

那美国还有啥?
wass 写了: 2025年 2月 8日 22:32 所以以后堆算法,堆马工,美国比不上国内的996
这个煎饼多少钱? :D viewtopic.php?t=833307

凡所有相,皆是虚妄

图片
头像
TheMatrix楼主
论坛支柱
论坛支柱
2024年度优秀版主
TheMatrix 的博客
帖子互动: 264
帖子: 13269
注册时间: 2022年 7月 26日 00:35

#29 Re: ChatGPT generated Python code

帖子 TheMatrix楼主 »

TheMatrix 写了: 2025年 2月 8日 21:39 图片
上面是昨天deepseek-r1的第一个版本。当然,我当时已经问过chatgpt和deepseek-v3,问题已经给到比较明确了。

这个版本已经非常接近了。只是它没有把解sort好,所以连线变成了zigzag形状了。这个版本只要把sort弄好就差不多了。

昨天的第二个版本,我的提示可能不是很明确,它没有在第一个版本的基础上改进,而是大概用了一个新的算法,结果差得更远了。

今天我又来调它,我提示它第一个版本已经非常接近,只需要把sort弄好就行了。结果它用了nearest neighbor算法。这就对了。

我又让它用我的参数 a,b=-2,1。

结果相当不错:

代码: 全选

import numpy as np
import matplotlib.pyplot as plt
from mpl_toolkits.mplot3d import Axes3D
from scipy.spatial import cKDTree
from scipy.interpolate import splprep, splev

# Updated elliptic curve parameters
a, b = -2, 1  # Changed from (-1, 1)

# Generate initial points using spherical coordinates with higher density
phi = np.linspace(0, 2*np.pi, 800)
theta = np.linspace(0, np.pi, 800)
Phi, Theta = np.meshgrid(phi, theta)
X = np.sin(Theta) * np.cos(Phi)
Y = np.sin(Theta) * np.sin(Phi)
Z = np.cos(Theta)

# Filter points that satisfy both equations with tighter tolerance
mask = np.abs(Y**2 * Z - (X**3 + a*X*Z**2 + b*Z**3)) < 0.005
points = np.vstack([X[mask], Y[mask], Z[mask]]).T

def geometric_sort(points):
    """Sort points using Hamiltonian path with curvature-aware search"""
    if len(points) < 2:
        return points
    
    # Build KD-tree for efficient spatial queries
    tree = cKDTree(points)
    
    # Start with point closest to average position
    start_idx = np.argmin(np.linalg.norm(points - np.mean(points, axis=0), axis=1))
    sorted_points = [points[start_idx]]
    visited = set([start_idx])
    
    current_idx = start_idx
    while len(visited) < len(points):
        # Find nearest 15 unvisited neighbors
        dists, indices = tree.query(points[current_idx], k=15)
        
        # Select best candidate based on curvature continuity
        best_idx = None
        min_angle = np.inf
        current_dir = sorted_points[-1] - sorted_points[-2] if len(sorted_points) > 1 else None
        
        for idx in indices:
            if idx not in visited and idx < len(points):
                candidate_dir = points[idx] - sorted_points[-1]
                if current_dir is not None:
                    angle = np.arccos(np.dot(current_dir, candidate_dir)/(
                        np.linalg.norm(current_dir)*np.linalg.norm(candidate_dir)+1e-8))
                else:
                    angle = 0
                
                if angle < min_angle:
                    min_angle = angle
                    best_idx = idx
        
        if best_idx is not None:
            sorted_points.append(points[best_idx])
            visited.add(best_idx)
            current_idx = best_idx
        else:
            break
    
    return np.array(sorted_points)

# Sort points using improved geometric ordering
sorted_points = geometric_sort(points)

# Split into continuous segments with dynamic threshold
dists = np.linalg.norm(np.diff(sorted_points, axis=0), axis=1)
median_dist = np.median(dists)
split_indices = np.where(dists > 5*median_dist)[0] + 1
branches = np.split(sorted_points, split_indices)

# Process each branch
smooth_curves = []
for branch in branches:
    if len(branch) < 20:
        continue
    
    # Closed curve detection
    closure_dist = np.linalg.norm(branch[0] - branch[-1])
    periodic = closure_dist < 0.1 * median_dist
    
    # Adaptive spline smoothing
    try:
        tck, u = splprep(branch.T, s=0, per=periodic)
        u_fine = np.linspace(0, 1, 1500 if periodic else 1000)
        x_new, y_new, z_new = splev(u_fine, tck)
        smooth_curves.append(np.vstack([x_new, y_new, z_new]).T)
    except:
        continue

# Combine all segments
final_curve = np.concatenate(smooth_curves)

# ... (keep all previous code until the plotting section)

# Create 3D visualization
fig = plt.figure(figsize=(12, 10))
ax = fig.add_subplot(111, projection='3d')

# Plot the smoothed curve
ax.plot(final_curve[:,0], final_curve[:,1], final_curve[:,2], 
        c='darkred', lw=2.5, alpha=0.95)

# Enhanced sphere wireframe with clearer visibility
theta, phi = np.mgrid[0:2*np.pi:40j, 0:np.pi:20j]  # Increased grid density
x_sphere = np.sin(phi) * np.cos(theta)
y_sphere = np.sin(phi) * np.sin(theta)
z_sphere = np.cos(phi)

# Custom wireframe parameters
ax.plot_wireframe(x_sphere, y_sphere, z_sphere, 
                 color='#404040',  # Darker gray color
                 alpha=0.25,       # Reduced transparency
                 linewidth=0.8,    # Thicker lines
                 edgecolor='#202020',  # Even darker edges
                 rstride=2, 
                 cstride=2)

# Configure view
ax.view_init(elev=25, azim=-45)
ax.set_xlim(-1.1, 1.1)
ax.set_ylim(-1.1, 1.1)
ax.set_zlim(-1.1, 1.1)
ax.set_box_aspect([1,1,1])

# Enhanced lighting and background
ax.xaxis.pane.set_color('white')
ax.yaxis.pane.set_color('white')
ax.zaxis.pane.set_color('white')
ax.xaxis.pane.set_alpha(0.9)
ax.yaxis.pane.set_alpha(0.9)
ax.zaxis.pane.set_alpha(0.9)
ax.grid(False)

# Labels and title with improved styling
ax.set_xlabel('X', fontsize=12, labelpad=12, fontweight='bold')
ax.set_ylabel('Y', fontsize=12, labelpad=12, fontweight='bold')
ax.set_zlabel('Z', fontsize=12, labelpad=12, fontweight='bold')
ax.set_title(f'Elliptic Curve y²z = x³ + {a}xz² + {b}z³ on Unit Sphere', 
            fontsize=14, pad=20, fontweight='bold')

plt.tight_layout()
plt.show()

visual:

图片

它少了一个branch,显示的是z-轴下方的branch,z-轴上方应该还有一个。
x1 图片
头像
TheMatrix楼主
论坛支柱
论坛支柱
2024年度优秀版主
TheMatrix 的博客
帖子互动: 264
帖子: 13269
注册时间: 2022年 7月 26日 00:35

#30 Re: ChatGPT generated Python code

帖子 TheMatrix楼主 »

TheMatrix 写了: 2025年 2月 9日 13:21
visual:

图片

它少了一个branch,显示的是z-轴下方的branch,z-轴上方应该还有一个。
再加一个symmetric branch,它不知道用什么方法,第一次做的不对,图形乱了。我提示它直接用symmetric about the origin。

这就是final code:

代码: 全选

import numpy as np
import matplotlib.pyplot as plt
from mpl_toolkits.mplot3d import Axes3D
from scipy.spatial import cKDTree
from scipy.interpolate import splprep, splev

# Elliptic curve parameters
a, b = -2, 1

# Modified to only capture negative-z hemisphere for original branch
phi = np.linspace(0, 2*np.pi, 800)
theta = np.linspace(np.pi/2, np.pi, 800)  # Only negative-z hemisphere (π/2 to π)
Phi, Theta = np.meshgrid(phi, theta)
X = np.sin(Theta) * np.cos(Phi)
Y = np.sin(Theta) * np.sin(Phi)
Z = np.cos(Theta)

# Strict filtering for original negative-z branch
mask = (np.abs(Y**2 * Z - (X**3 + a*X*Z**2 + b*Z**3)) < 0.005) & (Z < 0)
points = np.vstack([X[mask], Y[mask], Z[mask]]).T

def geometric_sort(points):
    """Sort points using Hamiltonian path with curvature-aware search"""
    if len(points) < 2:
        return points
    
    tree = cKDTree(points)
    start_idx = np.argmin(np.linalg.norm(points - np.mean(points, axis=0), axis=1))
    sorted_points = [points[start_idx]]
    visited = set([start_idx])
    
    current_idx = start_idx
    while len(visited) < len(points):
        _, indices = tree.query(points[current_idx], k=15)
        
        best_idx = None
        min_angle = np.inf
        current_dir = sorted_points[-1] - sorted_points[-2] if len(sorted_points) > 1 else None
        
        for idx in indices:
            if idx not in visited and idx < len(points):
                candidate_dir = points[idx] - sorted_points[-1]
                if current_dir is not None:
                    angle = np.arccos(np.dot(current_dir, candidate_dir)/(
                        np.linalg.norm(current_dir)*np.linalg.norm(candidate_dir)+1e-8))
                else:
                    angle = 0
                
                if angle < min_angle:
                    min_angle = angle
                    best_idx = idx
        
        if best_idx is not None:
            sorted_points.append(points[best_idx])
            visited.add(best_idx)
            current_idx = best_idx
        else:
            break
    
    return np.array(sorted_points)

# Process original branch
sorted_points = geometric_sort(points)
dists = np.linalg.norm(np.diff(sorted_points, axis=0), axis=1)
split_indices = np.where(dists > 5*np.median(dists))[0] + 1
branches = np.split(sorted_points, split_indices)

smooth_curves = []
for branch in branches:
    if len(branch) < 20: continue
    closure_dist = np.linalg.norm(branch[0] - branch[-1])
    periodic = closure_dist < 0.1*np.median(dists)
    
    try:
        tck, u = splprep(branch.T, s=0, per=periodic)
        u_new = np.linspace(0, 1, 1500 if periodic else 1000)
        x_new, y_new, z_new = splev(u_new, tck)
        smooth_curves.append(np.vstack([x_new, y_new, z_new]).T)
    except:
        continue

original_curve = np.concatenate(smooth_curves)

# Create proper projective symmetric branch through origin reflection
symmetric_curve = -original_curve.copy()  # Correct origin symmetry

# Visualization
fig = plt.figure(figsize=(12, 10))
ax = fig.add_subplot(111, projection='3d')

# Plot both branches with solid lines
ax.plot(original_curve[:,0], original_curve[:,1], original_curve[:,2],
        c='royalblue', lw=2.2, alpha=0.95, label='Original Branch (z < 0)')
ax.plot(symmetric_curve[:,0], symmetric_curve[:,1], symmetric_curve[:,2],
        c='crimson', lw=2.2, alpha=0.95, label='Symmetric Branch (z > 0)')

# Reference sphere
theta, phi = np.mgrid[0:2*np.pi:40j, 0:np.pi:20j]
ax.plot_wireframe(np.sin(phi)*np.cos(theta), np.sin(phi)*np.sin(theta), np.cos(phi),
                 color='#404040', alpha=0.2, linewidth=0.8, rstride=2, cstride=2)

# Configure view
ax.view_init(elev=25, azim=-45)
ax.set(xlim=(-1.1, 1.1), ylim=(-1.1, 1.1), zlim=(-1.1, 1.1))
ax.set_box_aspect([1,1,1])
ax.xaxis.pane.set_color('white'), ax.yaxis.pane.set_color('white'), ax.zaxis.pane.set_color('white')
ax.grid(False)

# Labels and legend
ax.set_xlabel('X', fontsize=12, labelpad=12, fontweight='bold')
ax.set_ylabel('Y', fontsize=12, labelpad=12, fontweight='bold')
ax.set_zlabel('Z', fontsize=12, labelpad=12, fontweight='bold')
ax.set_title(f'Projective Symmetry: y²z = x³ + {a}xz² + {b}z³', fontsize=14, pad=20, fontweight='bold')
ax.legend(loc='upper left')

plt.tight_layout()
plt.show()
final visual:

图片
头像
verdelite(众傻之傻)
论坛元老
论坛元老
帖子互动: 926
帖子: 22847
注册时间: 2022年 7月 21日 23:33

#31 Re: ChatGPT generated Python code

帖子 verdelite(众傻之傻) »

TheMatrix 写了: 2025年 2月 9日 14:05 再加一个symmetric branch,它不知道用什么方法,第一次做的不对,图形乱了。我提示它直接用symmetric about the origin。

这就是final code:

代码: 全选

import numpy as np
import matplotlib.pyplot as plt
from mpl_toolkits.mplot3d import Axes3D
from scipy.spatial import cKDTree
from scipy.interpolate import splprep, splev

# Elliptic curve parameters
a, b = -2, 1

# Modified to only capture negative-z hemisphere for original branch
phi = np.linspace(0, 2*np.pi, 800)
theta = np.linspace(np.pi/2, np.pi, 800)  # Only negative-z hemisphere (π/2 to π)
Phi, Theta = np.meshgrid(phi, theta)
X = np.sin(Theta) * np.cos(Phi)
Y = np.sin(Theta) * np.sin(Phi)
Z = np.cos(Theta)

# Strict filtering for original negative-z branch
mask = (np.abs(Y**2 * Z - (X**3 + a*X*Z**2 + b*Z**3)) < 0.005) & (Z < 0)
points = np.vstack([X[mask], Y[mask], Z[mask]]).T

def geometric_sort(points):
    """Sort points using Hamiltonian path with curvature-aware search"""
    if len(points) < 2:
        return points
    
    tree = cKDTree(points)
    start_idx = np.argmin(np.linalg.norm(points - np.mean(points, axis=0), axis=1))
    sorted_points = [points[start_idx]]
    visited = set([start_idx])
    
    current_idx = start_idx
    while len(visited) < len(points):
        _, indices = tree.query(points[current_idx], k=15)
        
        best_idx = None
        min_angle = np.inf
        current_dir = sorted_points[-1] - sorted_points[-2] if len(sorted_points) > 1 else None
        
        for idx in indices:
            if idx not in visited and idx < len(points):
                candidate_dir = points[idx] - sorted_points[-1]
                if current_dir is not None:
                    angle = np.arccos(np.dot(current_dir, candidate_dir)/(
                        np.linalg.norm(current_dir)*np.linalg.norm(candidate_dir)+1e-8))
                else:
                    angle = 0
                
                if angle < min_angle:
                    min_angle = angle
                    best_idx = idx
        
        if best_idx is not None:
            sorted_points.append(points[best_idx])
            visited.add(best_idx)
            current_idx = best_idx
        else:
            break
    
    return np.array(sorted_points)

# Process original branch
sorted_points = geometric_sort(points)
dists = np.linalg.norm(np.diff(sorted_points, axis=0), axis=1)
split_indices = np.where(dists > 5*np.median(dists))[0] + 1
branches = np.split(sorted_points, split_indices)

smooth_curves = []
for branch in branches:
    if len(branch) < 20: continue
    closure_dist = np.linalg.norm(branch[0] - branch[-1])
    periodic = closure_dist < 0.1*np.median(dists)
    
    try:
        tck, u = splprep(branch.T, s=0, per=periodic)
        u_new = np.linspace(0, 1, 1500 if periodic else 1000)
        x_new, y_new, z_new = splev(u_new, tck)
        smooth_curves.append(np.vstack([x_new, y_new, z_new]).T)
    except:
        continue

original_curve = np.concatenate(smooth_curves)

# Create proper projective symmetric branch through origin reflection
symmetric_curve = -original_curve.copy()  # Correct origin symmetry

# Visualization
fig = plt.figure(figsize=(12, 10))
ax = fig.add_subplot(111, projection='3d')

# Plot both branches with solid lines
ax.plot(original_curve[:,0], original_curve[:,1], original_curve[:,2],
        c='royalblue', lw=2.2, alpha=0.95, label='Original Branch (z < 0)')
ax.plot(symmetric_curve[:,0], symmetric_curve[:,1], symmetric_curve[:,2],
        c='crimson', lw=2.2, alpha=0.95, label='Symmetric Branch (z > 0)')

# Reference sphere
theta, phi = np.mgrid[0:2*np.pi:40j, 0:np.pi:20j]
ax.plot_wireframe(np.sin(phi)*np.cos(theta), np.sin(phi)*np.sin(theta), np.cos(phi),
                 color='#404040', alpha=0.2, linewidth=0.8, rstride=2, cstride=2)

# Configure view
ax.view_init(elev=25, azim=-45)
ax.set(xlim=(-1.1, 1.1), ylim=(-1.1, 1.1), zlim=(-1.1, 1.1))
ax.set_box_aspect([1,1,1])
ax.xaxis.pane.set_color('white'), ax.yaxis.pane.set_color('white'), ax.zaxis.pane.set_color('white')
ax.grid(False)

# Labels and legend
ax.set_xlabel('X', fontsize=12, labelpad=12, fontweight='bold')
ax.set_ylabel('Y', fontsize=12, labelpad=12, fontweight='bold')
ax.set_zlabel('Z', fontsize=12, labelpad=12, fontweight='bold')
ax.set_title(f'Projective Symmetry: y²z = x³ + {a}xz² + {b}z³', fontsize=14, pad=20, fontweight='bold')
ax.legend(loc='upper left')

plt.tight_layout()
plt.show()
final visual:

图片
symmetric about the origin 是不对的。应该 symmetric about the equatorial plane.
没有光子;也没有量子能级,量子跃迁,量子叠加,量子塌缩和量子纠缠。
头像
TheMatrix楼主
论坛支柱
论坛支柱
2024年度优秀版主
TheMatrix 的博客
帖子互动: 264
帖子: 13269
注册时间: 2022年 7月 26日 00:35

#32 Re: ChatGPT generated Python code

帖子 TheMatrix楼主 »

verdelite 写了: 2025年 2月 9日 14:46 symmetric about the origin 是不对的。应该 symmetric about the equatorial plane.
No.

比如elliptic curve:y2=x3-2x+1

我的目的是把对应的齐次方程在球面上显示。

对应的齐次方程是:
y2z=x3-2xz2+z3

它的解由通过原点的直线构成,所以在球面上的交点就是symmetric about the origin。
wass
论坛精英
论坛精英
2024年度优秀版主
wass 的博客
帖子互动: 695
帖子: 7101
注册时间: 2022年 7月 23日 22:13

#33 Re: ChatGPT and DeepSeek generated Python code

帖子 wass »

应该算生僻问题
回复

回到 “STEM”