
师母已呆
油股有没有可能继医药股之后咸鱼翻身呢
版主: 牛河梁


#3 Re: 油股有没有可能继医药股之后咸鱼翻身呢
没可能,这次是沙特和聚聚联合绞杀页岩油。
x1

If printing money would end poverty, printing diplomas would end stupidity.


#9 Re: 油股有没有可能继医药股之后咸鱼翻身呢
Comparison of PEG Ratios for S&P 500 Sector ETFs
The following table compares the Price/Earnings to Growth (PEG) ratios for the 11 major S&P 500 sector ETFs (Select Sector SPDR Funds). These ratios are based on trailing P/E divided by the expected EPS growth rate over the next 5 years, using representative industry data within each sector for calculation. Lower PEG ratios (typically under 1.0-1.5) may suggest undervaluation relative to growth prospects. Data is as of the most recent update available.
| Sector | ETF Ticker | PEG Ratio |
|---|---|---|
| Financials | XLF | 1.13 |
| Consumer Staples | XLP | 2.04 |
| Industrials | XLI | 2.14 |
| Consumer Discretionary | XLY | 2.36 |
| Materials | XLB | 2.55 |
| Health Care | XLV | 2.61 |
| Utilities | XLU | 2.78 |
| Information Technology | XLK | 3.08 |
| Energy | XLE | 4.15 |
| Real Estate | XLRE | 4.75 |
| Communication Services | XLC | N/A |
Key Insights:
- Financials (XLF) has the lowest PEG at 1.13, indicating strong value relative to expected growth.
- Communication Services (XLC) has no PEG due to negative expected growth in representative industries.
- Sectors like Real Estate (XLRE) and Energy (XLE) show higher PEGs, potentially signaling overvaluation or slower growth expectations compared to their P/E ratios.
There are two ways to conquer and enslave a country. One is by the sword. The other is by debt. - John Adams
#10 Re: 油股有没有可能继医药股之后咸鱼翻身呢
SPY PEG Ratio
The SPDR S&P 500 ETF Trust (SPY) tracks the S&P 500 index, so its PEG ratio is derived from the index's aggregate metrics. The PEG ratio is calculated as the trailing P/E ratio divided by the expected annual EPS growth rate over the next 5 years.
- Trailing P/E Ratio: 28.27 (as of recent data around October 2025).
- Expected 5-Year EPS Growth Rate: Approximately 12% (based on consensus estimates showing 10% for 2025, 14% for 2026, and 13% for 2027, averaging to a long-term projection in this range).
PEG Ratio: 28.27 / 12 ≈ 2.36.
This suggests the S&P 500 (and thus SPY) is moderately valued relative to its growth prospects—a PEG above 1.0 indicates it's not deeply undervalued but aligns with historical norms for the index (typically 1.5–2.5). For comparison, this is similar to the Consumer Discretionary sector's PEG (2.36) from recent sector data.
Note: PEG calculations can vary slightly by source due to differences in growth assumptions; always verify with real-time data for investment decisions.
There are two ways to conquer and enslave a country. One is by the sword. The other is by debt. - John Adams
#11 Re: 油股有没有可能继医药股之后咸鱼翻身呢
结论,做油股不如做银行股
There are two ways to conquer and enslave a country. One is by the sword. The other is by debt. - John Adams

#12 Re: 油股有没有可能继医药股之后咸鱼翻身呢
Bubble Index: Current vs 10-Year Average P/E
Rank ETF Sector Current P/E 10-yr Avg P/E Bubble Index
1 XLK Technology 38.0 23.9 1.59
2 XLB Materials 26.4 17.8 1.48
3 XLI Industrials 26.3 19.3 1.36
4 XLY Consumer Discretionary 29.3 23.7 1.24
5 XLF Financials 16.8 13.8 1.22
6 XLV Health Care 23.7 20.3 1.17
7 XLU Utilities 21.3 18.6 1.15
8 XLP Consumer Staples 22.9 20.6 1.11
9 XLC Communication Services 18.9 17.7 1.07
10 XLRE Real Estate 34.7 38.1 0.91
11 XLE Energy 15.7 18.6 0.84
楼上PEG显示 XLF XLI XLP 有潜力高回报
本楼泡沫度显示 XLE XLRE XLC XLP 低泡沫低风险
综合,XLP较低风险较高回报。
#13 Re: 油股有没有可能继医药股之后咸鱼翻身呢
NSDQ 写了: 2025年 10月 4日 18:22Bubble Index: Current vs 10-Year Average P/E
Rank ETF Sector Current P/E 10-yr Avg P/E Bubble Index
1 XLK Technology 38.0 23.9 1.59
2 XLB Materials 26.4 17.8 1.48
3 XLI Industrials 26.3 19.3 1.36
4 XLY Consumer Discretionary 29.3 23.7 1.24
5 XLF Financials 16.8 13.8 1.22
6 XLV Health Care 23.7 20.3 1.17
7 XLU Utilities 21.3 18.6 1.15
8 XLP Consumer Staples 22.9 20.6 1.11
9 XLC Communication Services 18.9 17.7 1.07
10 XLRE Real Estate 34.7 38.1 0.91
11 XLE Energy 15.7 18.6 0.84楼上PEG显示 XLF XLI XLP 有潜力高回报
本楼泡沫度显示 XLE XLRE XLC XLP 低泡沫低风险综合,XLP较低风险较高回报。
XLP也是我目下的选择。
There are two ways to conquer and enslave a country. One is by the sword. The other is by debt. - John Adams
#14 Re: 油股有没有可能继医药股之后咸鱼翻身呢
There are two ways to conquer and enslave a country. One is by the sword. The other is by debt. - John Adams
#15 Re: 油股有没有可能继医药股之后咸鱼翻身呢
肯定的呀,无论啥标的都有牛的时候。就是要等一下而已。油价涨到150不是梦。当然了跌到30也是可能的。
木头姐的ARK ETF,很多从低点都涨了4-5倍了,即将新高,你在2022年的时候能想象吗?
#16 Re: 油股有没有可能继医药股之后咸鱼翻身呢
why?
If printing money would end poverty, printing diplomas would end stupidity.
#18 Re: 油股有没有可能继医药股之后咸鱼翻身呢
纯粹是因为中短期的版块轮动。
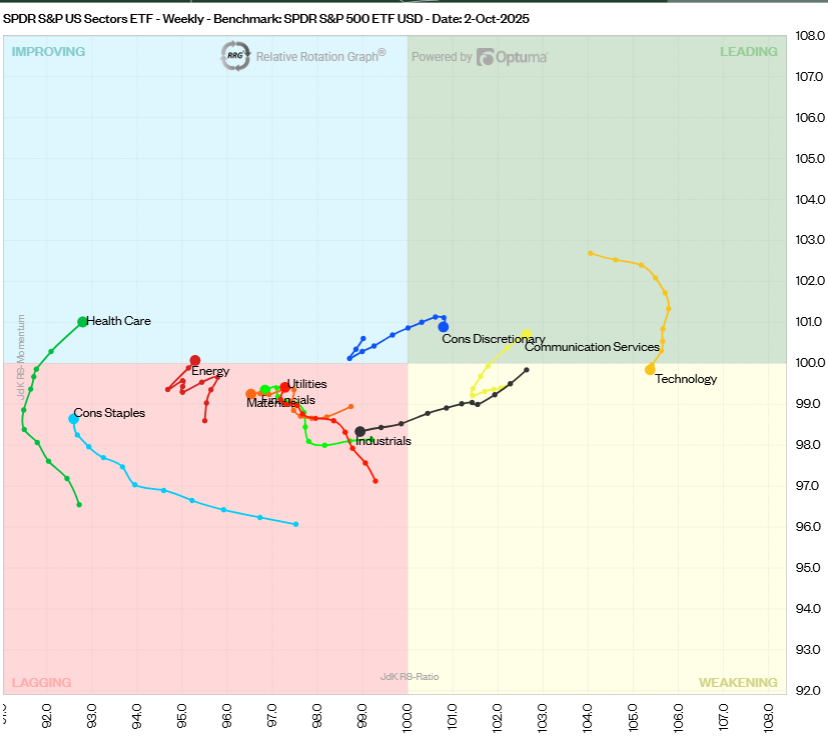
而且目前的基本面不是降息,而是pre-降息。通常pre-降息,防御版块表象好,比如最近反弹的XLV,接下来2-8周可能还加上XLP。其实XLE也是防御版块,可是川普过去的表现说明不知为啥川普就是和油价有仇。反而新能源版块在他的领导下一直表现很好。 $ICLN YTD 40%。执政四年翻倍很有可能。
x1
There are two ways to conquer and enslave a country. One is by the sword. The other is by debt. - John Adams